


A/B Testing for Machine Learning Models: What, Why, When, and How
#2 An Introductory Guide to A/B Testing for ML Engineers


Let’s imagine this: After going through all the hurdles, you’ve just built a new version of your machine learning model, and you’re excited to deploy it. But there’s that lingering question—will it really outperform the current model in the real world? This is where A/B testing comes in, providing the perfect way to validate your new model in live environments.
Whether you’re fine-tuning a recommendation system, optimizing ad performance, or enhancing a search algorithm, A/B testing allows you to make data-driven decisions by testing two versions side by side and comparing their performance with real users.
In this blog, I’ll walk you through what A/B testing is, why it’s essential for machine learning models, when to use it, and how to implement it effectively. Ready? Let’s dive in!
If you double the number of experiments you do per year, you’re going to double your inventiveness. - Jeff Bezos
Before diving into the A/B testing process, it’s essential to understand how models are evaluated both before and after deployment. Two key approaches are used for this: offline evaluation and online evaluation.
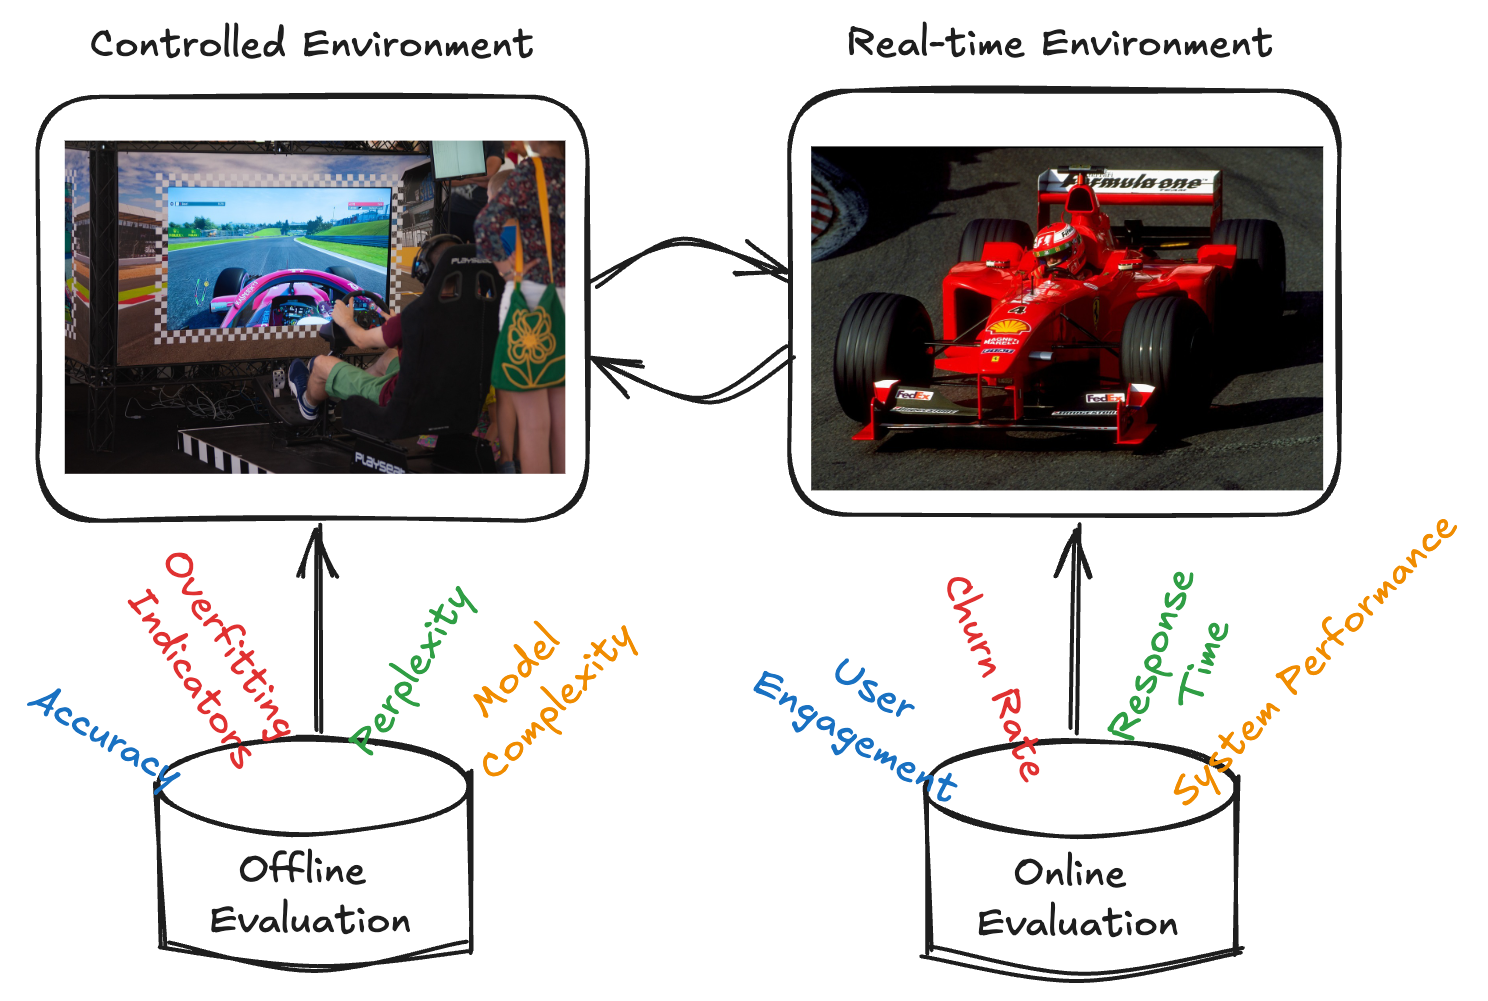
Offline evaluation acts as the model’s first test, assessing its performance on historical data in a controlled environment. This involves splitting a dataset into training, validation, and test sets, allowing the model’s predictive power to be measured using metrics like accuracy, precision, and recall. In this phase, the model is tested on unseen data (test set) to ensure it can generalize beyond the training data, helping data scientists improve the model before real-world use.
Online evaluation, in contrast, takes place in real-time after the model is deployed. Here, the model interacts with live users, offering valuable insights into how well it performs in unpredictable, real-world scenarios. This method often reveals challenges like data drift (when input data changes over time) or evolving user behavior. Metrics like latency, user engagement, and feedback become critical for understanding real-world performance.
Let’s consider GPT-2, a large language model, to see these evaluations in action.
Offline Evaluation for GPT-2
When developing GPT-2, offline evaluation measures its ability to generate coherent and contextually accurate responses. Key metrics include:
Perplexity: This measures how uncertain the model is in predicting the next word in a sequence. Lower perplexity suggests the model understands language patterns better.
BLEU score: Used to measure the overlap between the model’s generated text and a reference, especially in tasks like translation or summarization.
During this phase, GPT-2 might be tested on factual accuracy, response relevance, and language fluency. For example, it should correctly answer factual questions like, “What is the capital of France?” (Answer: “Paris”) and provide grammatically correct responses that are relevant to the context.
Online Evaluation for GPT-2
When GPT-2 is deployed, online evaluation helps monitor its performance with live user queries. Key metrics include:
User engagement: Do users engage in multi-turn conversations or drop off quickly?
Response satisfaction: Are users satisfied with the responses, as indicated by ratings or feedback?
Response accuracy: Does GPT-2 provide real-time, accurate answers to factual queries like, “What’s the weather in New York?”
Latency: How quickly does the model generate responses? Faster response times improve user experience.
Personalization: Does the model provide relevant, personalized recommendations based on user behavior?
By leveraging both offline and online evaluations, GPT-2 can be tested thoroughly in controlled conditions and then continuously improved based on real-world performance.
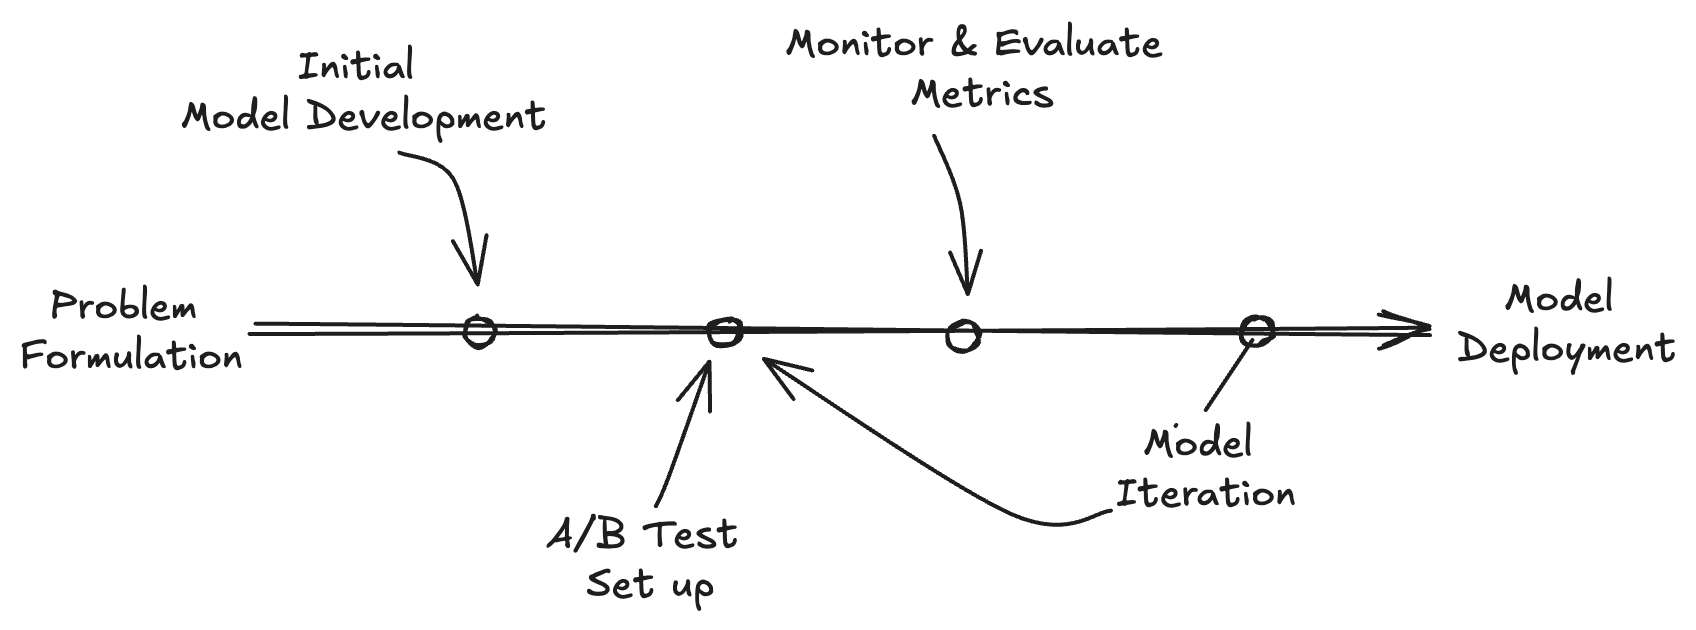
With both offline and online evaluations offering valuable insights into how well a model performs in controlled and real-world environments, the next step is to ensure that your model not only works well in theory but also delivers meaningful improvements in practice. This is where A/B testing becomes crucial.
A/B testing is crucial in ML model design as it systematically compares a new model’s performance against the existing one using real-world data. It provides actionable insights into how the model behaves in production, guiding optimizations beyond offline testing.
Here’s why A/B testing is so important for model improvement:
Validation in Real-World Scenarios: Offline evaluations often don’t capture real-world dynamics like user behavior changes or data drift. A/B testing enables models to be tested on live traffic, ensuring performance holds in production environments.
Reducing Deployment Risks: Gradually introducing a new model to a subset of users minimizes risks, identifying performance issues early while preventing potential negative impacts on user experience or business outcomes.
Data-Driven Decisions: A/B testing provides quantifiable feedback on key metrics, such as accuracy, user engagement, and business KPIs (e.g., conversion rates). This allows you to decide whether to keep, refine, or discard the new model.
Measuring Statistical Significance: A/B testing helps confirm that observed improvements are not due to chance, ensuring consistent performance improvements.
After establishing the workflow for A/B testing, the next key question you might ask yourself is: When should you implement A/B testing?
A/B testing isn’t always necessary, especially when updates are minor or purely technical. For example, if you’re making backend improvements, such as optimizing performance or retraining a model on updated data without changing the output, offline evaluation may be sufficient. In these cases, A/B testing might add unnecessary overhead without yielding valuable insights.
However, A/B testing becomes essential in certain scenarios. When you have multiple versions of a model and need to compare their performance in real-world conditions, it provides a controlled way to assess which model performs better. It’s particularly useful when user behavior is a key factor, such as in recommendation systems or search engines, where even small changes can have a significant impact on engagement. If your goal is to improve business metrics like click-through rates or revenue, A/B testing also helps quantify the effect of model changes, ensuring they align with broader business objectives.
By understanding when A/B testing is necessary, you can make more informed decisions about when to implement it, ensuring efficient model improvements with real-world benefits.
Now that we’ve explored why A/B testing is crucial and when it’s most effective, the next step is understanding how to execute A/B testing to get actionable results. A/B testing relies on statistical methods to ensure the performance difference between two models is significant and not due to chance. Let’s dive into the practical side, starting with two commonly used statistical tests—G-Test and Z-Test—which help validate whether the observed differences between your control and treatment groups are meaningful.
G-Test
The G-Test is often used to determine if there’s a significant difference in categorical data, like conversion rates or event counts between two groups. It’s particularly useful for smaller sample sizes or non-normally distributed data, where traditional methods like the Z-Test may not be ideal.
The G-Test compares observed frequencies (e.g., the number of conversions in the control and treatment groups) with expected frequencies under the assumption that there is no difference between the groups. The formula for the G-Test statistic is:
Where:
- Oᵢ represents the observed frequencies for each group (e.g., the actual number of conversions in each group),
- Eᵢ represents the expected frequencies under the null hypothesis (i.e., assuming no difference between the groups).
The G-value is compared against the chi-squared distribution to determine if the observed difference is statistically significant. If the p-value is below a certain threshold (e.g., 0.05), we can reject the null hypothesis and conclude that the difference is significant.
Z-Test
The Z-Test is typically used when comparing the means of two groups, such as the average click-through rates (CTR) of the control and treatment groups. The Z-Test assumes that the data is normally distributed, which is a reasonable assumption when the sample size is large, thanks to the central limit theorem.
The Z-Test statistic is calculated as:
Where:
- X̄₁ and X̄₂ are the means of the two groups (e.g., the average CTR of the control and treatment groups),
- σ₁² and σ₂² are the variances of the groups,
- n₁ and n₂ are the sample sizes of the groups.
The resulting Z-value is then compared against the standard normal distribution to determine the significance of the difference. A p-value lower than a set threshold (e.g., 0.05) indicates that the difference between the two groups is statistically significant.